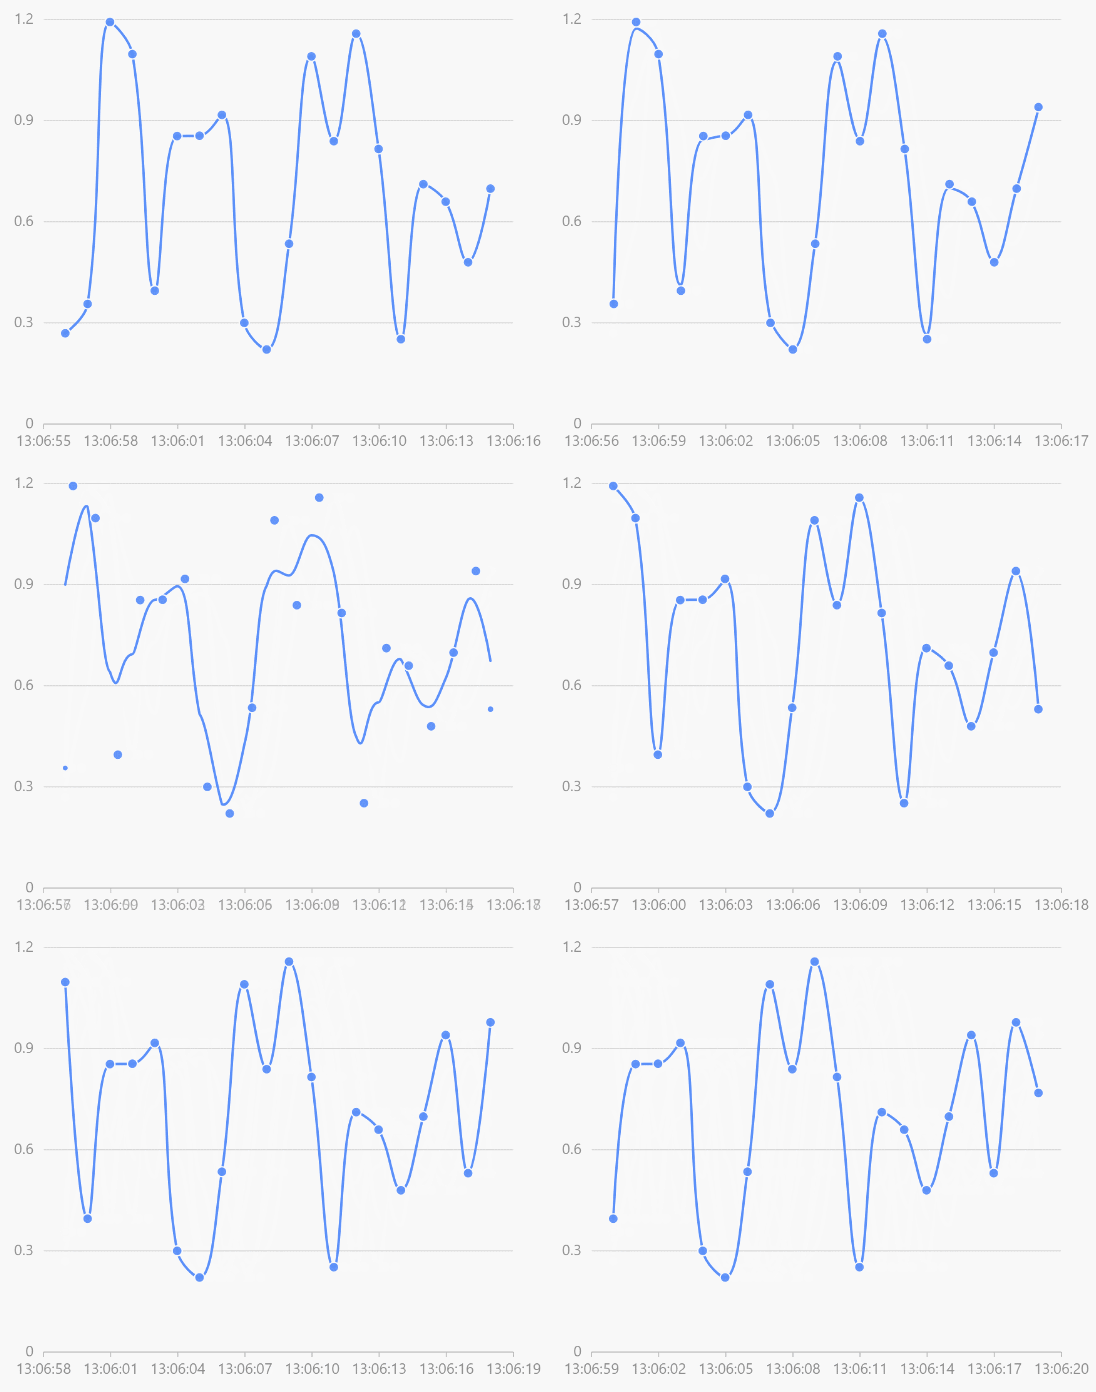
<template>
<div id="Histogram" ref="Histogram" :style="getHeight()"></div>
</template>
<script>
import { Column } from '@antv/g2plot'
let chartChange
export default {
props: {
value: {
type: Array,
default() {
return []
},
},
Height: {
type: Number,
default: 0,
},
},
data() {
return {
radarPlot: null,
}
},
watch: {
value: {
handler(newVal, oldVal) {
console.log(newVal)
chartChange.changeData(newVal)
},
deep: true,
},
},
mounted() {
this.initRadarPlot()
},
methods: {
initRadarPlot() {
chartChange = new Column(this.$refs.Histogram, {
data: this.value,
height: this.Height,
xField: 'label',
yField: 'amount',
label: {
position: 'top',
layout: [
{ type: 'interval-adjust-position' },
{ type: 'interval-hide-overlap' },
{ type: 'adjust-color' },
],
content: (originData) => {
return originData.amount + '%'
},
style: {
fill: '#000',
},
},
tooltip: {
formatter: (originData) => {
return { name: '占比', value: originData.amount + '%' }
},
},
xAxis: {
label: {
autoHide: true,
autoRotate: false,
},
},
yAxis: {
min: 0,
label: {
autoHide: true,
autoRotate: false,
},
},
meta: {
label: {
alias: '销售额趋势',
},
amount: {
alias: '占比',
},
},
})
chartChange.render()
},
getHeight() {
let height = parseInt(this.Height)
return { height: height + 'px' }
},
},
}
</script>
<style>
</style>
